Contents
In addition to showing whether a large number of opportunities actually represents a healthy pipeline, sales pipeline metrics help you answer three important questions:
- Do we have enough opportunities in our pipeline?
- Are those opportunities progressing?
- Will their potential become revenue within the expected time frame?
This guide outlines ten metrics you can use to measure pipeline performance, including how to calculate each one and what action to take when the data reveals a problem. A large pipeline is useful only when the opportunities inside it are qualified, moving and supported by buyer evidence.
TL;DR: the pipeline metrics that matter
| Metric | What it shows | Primary owner |
|---|---|---|
| Total pipeline value | The economic value of open opportunities | Sales leadership |
| Qualified opportunities created | Future pipeline supply | SDRs and AEs |
| Pipeline coverage | Ability to hit the target | Revenue leadership |
| Stage conversion rate | Where deals progress or get lost | Managers |
| Win rate | How effectively pipeline converts to revenue | Sales leadership |
| Average deal size | Revenue value per won deal | Finance and sales |
| Sales-cycle length | Time required to win | Sales and RevOps |
| Deal age and stage duration | Which opportunities are stuck | AEs and managers |
| Pipeline velocity | The estimated rate at which revenue moves through the pipeline | RevOps |
| Confirmed-next-step coverage | The proportion of opportunities with a buyer-agreed next action | AEs and managers |
What are sales pipeline metrics?
Sales pipeline metrics measure the quantity, quality, movement and conversion of potential business. While activity metrics, such as the number of calls, indicate that work is happening, opportunity metrics show how that activity affects potential revenue.
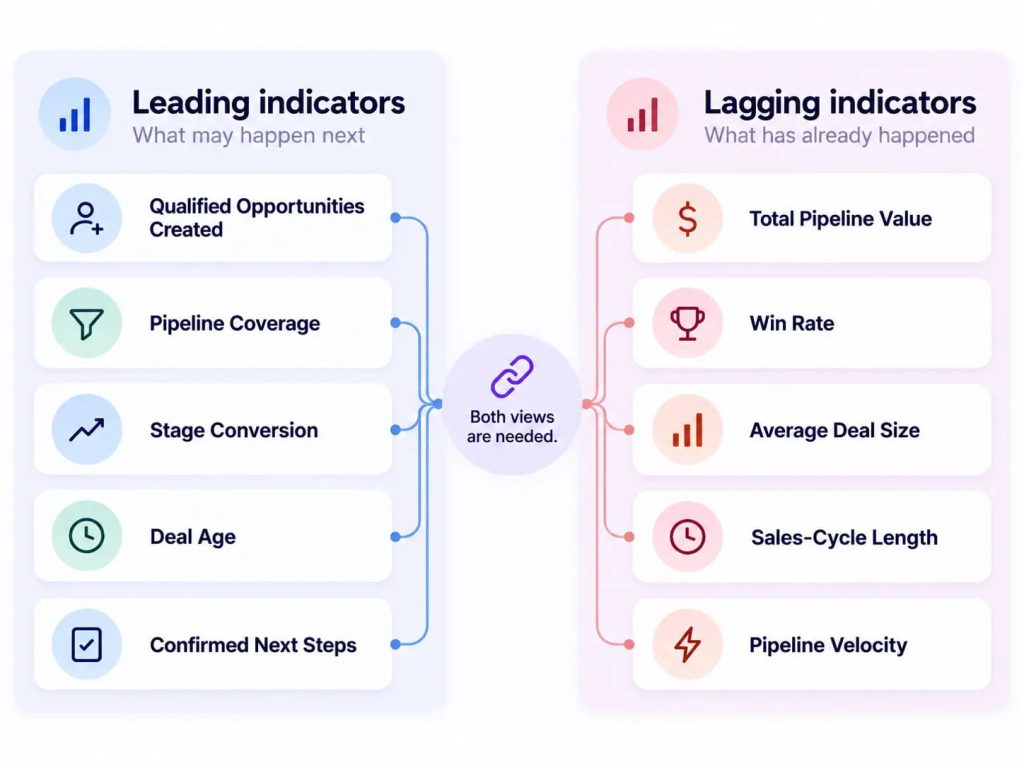
A strong pipeline view combines leading and lagging indicators.
Opportunity creation and confirmed next steps provide an early indication of future performance. Win rate and closed revenue explain what has already happened. You need both views: one signals what may happen next, while the other confirms what has already happened.
Salesforce's guide to sales pipeline management also distinguishes the active opportunities in a pipeline from the broader process used to monitor and progress them. That distinction matters when deciding what belongs on the dashboard.
Ten sales pipeline metrics and formulas
1. Total pipeline value
Total pipeline value is the total amount of all open opportunities in scope.
Total pipeline value = Total value of all open opportunities
Always define the time frame, team, currency and stages included in the report. Otherwise, you may combine deals that could close this quarter with opportunities that will take another year or more to close.
Action: Separate current-period pipeline from future pipeline, and remove opportunities that are clearly unqualified.
2. Qualified opportunities created
This measures how many new sales opportunities meet your team's qualification criteria within a defined time frame. It gives you a cleaner view of pipeline supply than lead volume or meetings booked.
The definition makes a difference. Do not treat every calendar meeting as an opportunity. Look for evidence of a real problem, a suitable potential customer, a clear next action and commercial viability.
Action: Examine this metric by source, such as LinkedIn; by segment, such as industry; and by rep to understand where your strongest pipeline comes from.
3. Pipeline coverage ratio
The pipeline coverage formula compares the existing qualified pipeline with the remaining revenue target. It helps determine whether the current pipeline is sufficient to meet that target.
Pipeline coverage = Qualified pipeline / Target to be closed
The required ratio may exceed 2× or even 3×, depending on the number of sales cycles left, the quality of the opportunities and which deals can realistically close in time. There is no universal coverage ratio that suits every sales team.
Action: Determine the pipeline-to-target ratio you need from historical conversion rates instead of relying on an arbitrary benchmark. HubSpot's explanation of sales pipeline coverage provides useful additional context for interpreting the ratio.
4. Stage conversion rate
The stage conversion rate is the percentage of opportunities that progress from one defined stage to the next.
Stage conversion rate = (Opportunities entering the next stage / Opportunities entering the current stage) × 100
A significant drop immediately after discovery may indicate qualification problems. A downturn at the proposal stage may point to weak value positioning, missing stakeholders or poor commercial alignment.
Action: Analyse deals by cohort. Do not compare recently created opportunities with deals that have already had months or years to reach an outcome.
5. Win rate
A winning opportunity is one that successfully converts into a sale.
Win rate = Number of winning deals / Total number of deals × 100
A revenue-based win rate shows how much potential revenue became closed-won revenue. Both methods are valid, but they measure different things. Deal-count win rate measures the frequency of wins, while revenue win rate measures the value captured from those wins.
Action: Break closed deals down by deal size, product, source and segment before drawing conclusions from the overall win rate.
6. Average deal size
Average deal size, sometimes called average selling price, measures the revenue generated per closed-won opportunity.
Average deal size = Total closed-won revenue / Total number of won deals
Increasing the average may improve productivity. However, it can also lengthen the sales cycle or concentrate risk across fewer opportunities.
Action: Review average deal size alongside cycle length and win rate
instead of interpreting it in isolation.
7. Average sales-cycle length
Sales-cycle length is the time from a consistent starting point until an opportunity is marked as won.
Average sales cycle = Total number of days taken to win deals / Number of won opportunities
Choose the starting point carefully. Measuring from lead creation produces a different result from measuring from the first meeting or qualification date. Consider using the median as well, so one or two unusually long deals do not distort the average.
Action: Compare similar groups of opportunities and identify the stages in which elapsed time has increased.
8. Deal age and time in stage
Deal age measures the time elapsed since an opportunity entered your sales funnel. Time in stage measures how long that opportunity has remained in its current stage.
Both metrics reveal stagnation that overall value and close dates may hide. An opportunity can retain the same value and close date while losing all of its momentum.
Actions:
- Set specific ageing ranges for each segment.
- Review overdue next steps, repeated close-date changes and buyer activity or the absence of it.
9. Sales pipeline velocity
Four key drivers determine the estimated value moving through the pipeline each day.
Pipeline velocity = Qualified opportunities × Win rate × Average deal size / Sales-cycle length
For example, if a team has 40 qualified opportunities, an average deal size of $20,000, a win rate of 25% and a 50-day sales cycle, its velocity would be $4,000 per day.
This equation helps you see where to apply effort because each input is a lever that can affect the outcome. It is a directional operating measure, not a guaranteed revenue forecast.
10. Confirmed-next-step coverage
This calculates the percentage of open sales opportunities with a buyer-agreed next action and date.
Next-step coverage = Opportunities with a dated next action / Qualified sales opportunities × 100
Although it may not appear in traditional accounting reports, next-step coverage is a useful indicator of deal quality. “Schedule a follow-up meeting in one week” is vague. “Technical review scheduled for Tuesday with the buyer's security lead and solutions engineer” is a defined next action.
Action: After each important customer conversation, record the next step, its owner, its date and its intended outcome.
How to read sales pipeline metrics together
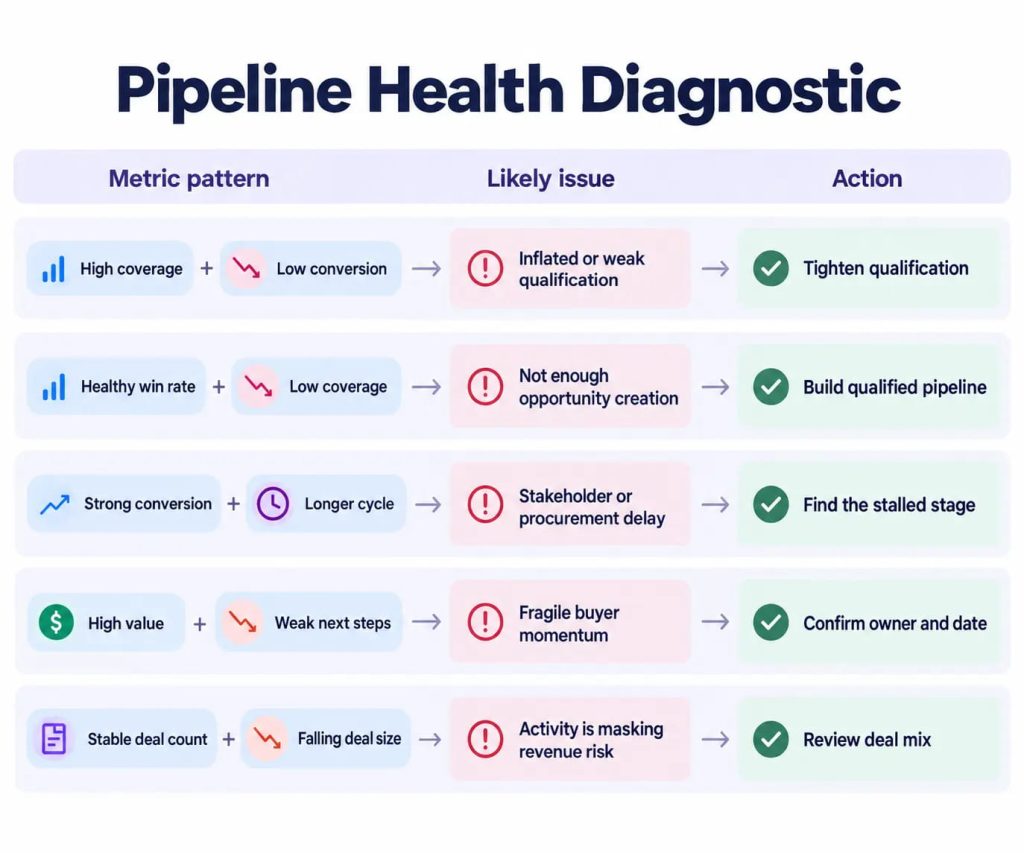
One metric rarely provides a complete picture. Combinations reveal more:
- Low conversion + high coverage: Your pipeline may be inflated or filled with low-quality opportunities.
- Healthy win rate + low coverage: Execution is working, but opportunity creation needs to improve.
- Good conversion + a long sales cycle: The team is winning suitable deals, but stakeholder access, procurement or the buying process is slowing progress.
- High pipeline value + weak next-step coverage: The number looks strong, but buyer commitment may not support it.
- Stable deal count + declining average deal size: The team is meeting an activity measure while missing the revenue-value measure.
Your dashboard should lead to a decision. If a metric does not help you set priorities, identify coaching needs or allocate resources, question why it receives prominent space.
How sales conversations improve sales pipeline metrics
CRM fields document the sales team's view of an opportunity. However, the strongest evidence often sits inside the buyer conversation: who has the final say, what is driving the purchase, which concerns are delaying it and what will happen next.
Salesman AI is an account-executive-first copilot that supports preparation, private AI sales role play and post-call review while connecting relevant buyer, meeting and opportunity context.
It does not replace your CRM or an executive forecasting platform. Instead, it helps turn meetings into clear risks, commitments and action items that AEs can use when updating the pipeline and deciding where to focus. Teams can also use AI meeting preparation to enter critical conversations with the relevant deal context already organised.
The CRM contains the fields; buyer conversations contain the evidence behind them.
Build a useful sales pipeline metrics dashboard
Keep the first view of your dashboard simple. A working dashboard should show:
- Qualified opportunities created
- Current-period pipeline value and pipeline coverage
- Stage conversion and time in stage
- Win rate and sales-cycle length by team and rep
- Pipeline velocity by source and segment
- Confirmed-next-step coverage
Filters for team, rep, source, segment and close period are also important. Most importantly, document the definition and formula behind every metric.
The first view should help a leader understand the situation without opening several reports. A second, more detailed view can then show the individual opportunities responsible for a change.
This keeps the dashboard useful for leadership while giving managers and AEs enough context to act on what they see.
If you are evaluating how different systems present these signals, this guide to the best sales reporting tools for account executives provides a useful comparison. You can also review deal tracking software to see how tools handle opportunity-level context.
Frequently asked questions
What are the most important sales pipeline metrics?
Start with qualified opportunities created, pipeline coverage, stage conversion, win rate, sales-cycle length, deal age and confirmed next-step coverage. Together, they show pipeline supply, movement, conversion and the quality of buyer commitment.
Is there an ideal pipeline coverage ratio?
There is no perfect ratio for every team. The amount of qualified pipeline required depends on historical win rate, the available time frame and the mix of deals. Teams with lower conversion generally need more qualified pipeline to achieve the same target.
How frequently should I review my pipeline metrics?
Operational measures, such as next steps and deal age, can be reviewed weekly. Leadership may review coverage and forecasting weekly or monthly depending on the sales cycle. Keep the definitions consistent every time you review the numbers.
Measure movement, not just volume
Assessing the movement of opportunities is as important as counting them.
A useful set of sales pipeline metrics shows whether opportunities are being created, progressing and closing. It also reveals whether a large total pipeline is hiding old, stalled opportunities or weak buyer commitment.
Build the dashboard around decisions, use consistent definitions and review the customer evidence supporting every critical change. Help AEs prepare for the next meeting and follow up on the conversations that create that evidence.
Measure movement, not just volume and never let a healthy-looking total hide a pipeline that buyers are not advancing.