Contents
A forecast may appear to be accurate. However, there are many factors that can influence the accuracy of forecasts. This is often not related to how you built your spreadsheet or model.
Different sales forecasting techniques answer different questions. Historical forecasting assumes that the past is a predictor of the future. Opportunity forecasting takes all currently active deals into consideration. Predictive modelling uses multiple input signals and requires clean data.
This article will describe eight different methods for making forecasts, including the advantages of using each type and why combining the best of these different methods generally results in more credible forecasts.
TL;DR: sales forecasting techniques at a glance
| Technique | Best used when | Main strength | Main risk |
|---|---|---|---|
| Historical forecasting | Performance is stable | Fast baseline | Misses market changes |
| Opportunity-stage forecasting | CRM stages are reliable | Simple pipeline view | Stage probabilities can mislead |
| Forecast-category method | Managers inspect deals regularly | Includes seller judgement | Confidence can replace evidence |
| Sales-cycle forecasting | Deal timing is predictable | Accounts for opportunity age | Breaks when cycles vary widely |
| Lead-driven forecasting | Lead sources are measurable | Connects demand to revenue | Needs reliable conversion data |
| Multivariable forecasting | Data is clean and plentiful | Considers several signals | Harder to explain and maintain |
| Test-market forecasting | Launching something new | Uses real market response | Small tests may not generalise |
| Qualitative forecasting | Historical data is limited | Works in unfamiliar conditions | Vulnerable to bias |
What is sales forecasting?
A sales forecast is an estimate of how much revenue a company expects to earn within a given time frame.
An estimate may be based on the company's historical performance, its current or future sales pipeline (open opportunities), buyer behavior, marketplace data, and/or seller judgment.
A target represents what the team wishes to accomplish. A forecast represents what the team is currently likely to accomplish.
Treating the target as the forecast can hide risks rather than help the business prepare for them.
Eight sales forecasting techniques and examples
1. Historical forecasting
Historical forecasting takes historical data from an earlier period to predict revenue at a future date. For example, if your company made $500,000 in Q2 and you expect a 10% increase, then your initial forecast would be $550,000.
This forecasting technique is fast and good for companies with steady business and predictable customer demand. It does, however, ignore the value of what is currently in the pipeline. Changes such as seasonality, price increases, loss of staff and/or competition could completely render last year's numbers useless.
Use this forecasting technique: As a baseline for other forecasting methods.
2. Opportunity-stage forecasting
The technique gives you a close probability for every stage of your sales pipeline. The expected revenue can be found by multiplying the deal size by its corresponding stage probability (i.e., the percent chance of winning).
A $100,000 deal with a historical average closing probability of 60% would add $60,000 to the weighted forecast.
This is a relatively straightforward approach to use; however, this is only possible when all stage names have the same definition across time. An example of when the different definitions will cause problems is using a 50% win rate on a proposal that was sent out without identifying a decision maker versus a proposal that has a confirmed buying process.
Use it for: Teams that have a good understanding of their CRM stages and enough data or history to establish the win rates at each stage.
3. Forecast-category method
Sellers can use forecasting categories like pipe, best case, commit & close to show confidence in deals that are further along than the CRM. A late stage deal is still "best case" if you don't know when the procurement team will make their decisions. On the other hand, an early stage renewal of a contract would actually be considered a real commitment.
While this gives your manager some additional context, they also need to see the buyer evidence behind each category. Evidence from the buyer includes a confirmed decision date, approval of the business case and/or an upcoming procurement meeting.
“The call was great” does not constitute proof that the deal has progressed.
Use it for: Weekly forecasting meetings where each deal has been thoroughly inspected.
4. Length-of-sales-cycle forecasting
Sales-cycle forecasting considers both the time elapsed (the opportunity's age) and the average duration of a sales cycle (the time required to close). For example, if your company typically closes similar deals within 90 days, you would probably consider a qualified opportunity created 75 days ago as being closer to closure than an opportunity created last week.
Sales-cycle forecasting provides a better model than stage-weighting, since opportunities are often moving from stage-to-stage at varying rates. However, averages can mask significant variability among segments, product offerings and deal size.
Apply this method to: Companies with repetitive sales cycles and distinct deal groups.
5. Lead-driven forecasting
Lead-driven forecasting uses historical data to reverse-engineer forecasting using the three core elements of lead volume, conversion rates and average deal values.
For example, if you are producing 1,000 qualified leads per month (lead volume), 4% convert into paying customers (conversion rate), and each customer purchases an item that costs $5,000 on average (average deal value), your total forecast would be $200,000.
$200,000 = 1,000 × 0.04 × $5,000
This type of planning also allows marketers and salespeople to work in concert. However, this approach can be weakened by changes in lead quality and by using average conversion rates across many different lead sources.
Use this method for: A high-volume funnel with reliable, accurate source-level conversion data.
6. Multivariable forecasting
Models in multivariate include the signals of deal value, deal stage, age of opportunity, performance of your reps, level of engagement and other relevant characteristics of accounts. The AI tools used for forecasting are able to identify trends that would likely go unnoticed when using an Excel or Google Sheets format.
However, complex does not necessarily mean accurate. Poor data quality (i.e., missing CRM information) or poorly defined stages can negatively affect the model. Additionally, teams should have some idea of which signals are influencing their predictions.
Use it for: Datasets that are larger than average and consist of multiple fields with strong analytical support.
7. Test-market forecasting
Test-market forecasting involves launching an item in a single geographic area (i.e., country, state or city) as well as testing an item with a specific type of consumer (e.g., young people or seniors). The results are then used to gauge how successful that product will be when released nationwide.
This method can provide a better basis than simply estimating what a new item would do using historical sales data. However, if the test group does not reflect the larger target market, there could be significant inaccuracies in estimates based on the results. For example, a high response rate among existing loyal consumers may not translate into similar success when marketing to new potential customers.
When to use it: For new items, changes to your packaging and expanding markets.
8. Qualitative forecasting
Qualitative forecasting uses structured input from salespeople, managers, customers and other experts. This method is helpful when there is no prior data to use, such as when launching a brand-new category in an unfamiliar marketplace or when a significant shift occurs in a market.
The key term here is “structured.” Get the contributors to outline their assumptions, provide evidence and identify areas of uncertainty in their responses. Otherwise, you will have nothing but the opinions of the most confident individuals in the meeting room.
It’s good for: Markets that are new or unfamiliar and for which there is no quantifiable prior history.
How to choose a sales forecasting method
Choose based on your decision, data and time horizon:
- For a quick organisational baseline, use historical forecasting.
- To call your short-term pipeline, use opportunity-stage forecasting or forecast categories.
- If you don't know the timing of a sales cycle, use sales-cycle forecasting.
- If the need to determine demand and capacity requirements in advance is greater than the uncertainty about timing, use lead-driven forecasting.
- When there is enough good-quality data to support this type of model, use multivariable forecasting.
- As a last resort, or an initial step into a market, use test-market or qualitative forecasting when you have no experience in that specific area.
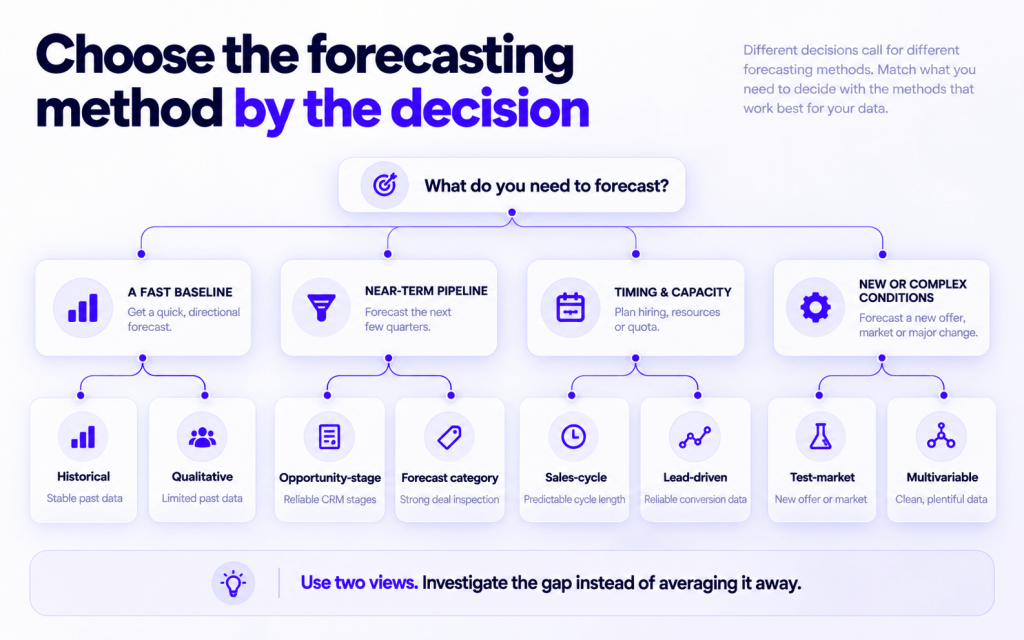
In general, consider using at least two different views. For example, compare a top-down historical view (baseline) with a bottom-up opportunity view. If they differ, question the assumptions instead of simply taking the average without providing an explanation.
How to improve sales forecast accuracy
Identify stages based on buyer evidence
There must be tangible evidence of the seller completing each stage. For example, the "proposal" stage should require confirmation of requirements, known stakeholders and a mutually agreed review date. Seller actions alone are not enough.
Segment sales motions separately
Enterprise deals, small-business deals and renewals should each have their own win rate and cycle length. Wherever there is a material difference in buying behavior, segment your model.
Monitor movement vs. snapshots
You can monitor changes in deal value over time. However, a deal is not necessarily less risky when the close date has moved twice or the next meeting has disappeared. Track the movement of deal value, timing, stakeholders and buyer commitments.
Review what was said behind the fields in your CRM system
The CRM data will tell you what the team entered. The conversations with buyers will reveal whether the underlying assumptions are true.
Salesman AI gives account executives the ability to prepare for meetings, practise key conversations and convert completed calls into risks, commitments and next steps.
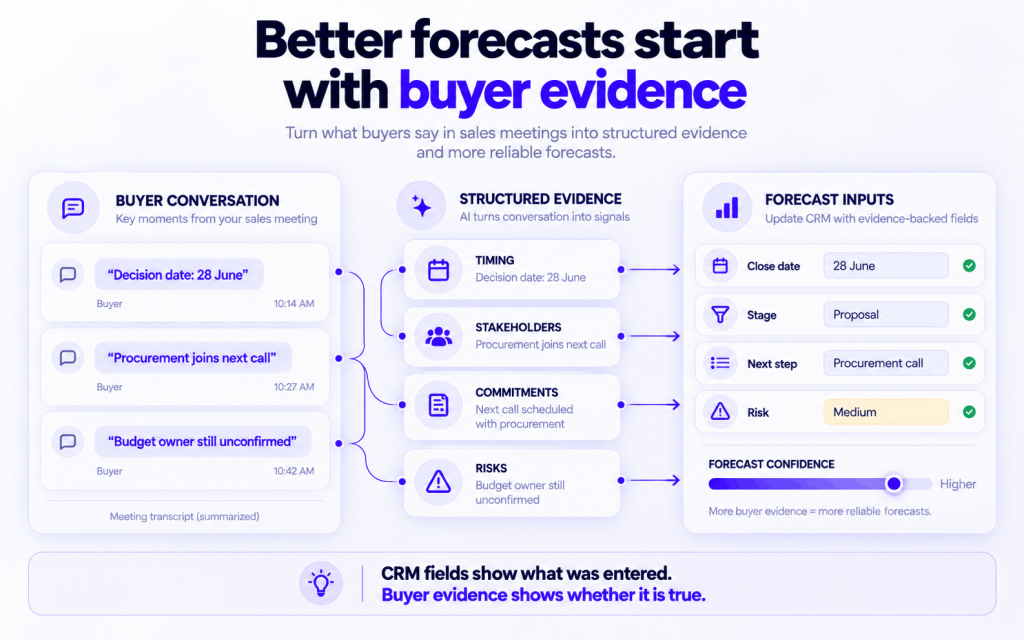
Salesman AI is not a corporate forecasting platform. It enables account executives to strengthen the meeting and deal evidence they use to keep opportunity records up to date. Teams can then review that evidence alongside the information captured by their deal tracking software and sales reporting tools.
Frequently asked questions
What are the most frequently used sales forecasting techniques?
Common approaches include using historical forecasting techniques, applying opportunity-stage weightings, creating multiple forecast categories (e.g., "closed won" and "closed lost"), forecasting based on sales-cycle stages, using lead-based models (where leads are potential customers), multivariate statistical analysis, conducting test-market research or making educated guesses based on personal experience and qualitative judgement.
Is there a single sales forecasting approach that will always yield the most accurate results?
There isn't a single best approach, as every organization has its own combination of factors influencing forecast accuracy, such as data-quality issues, inconsistent sales cycles and forecast horizons. Organizations with mature teams typically evaluate more than one sales forecasting approach and monitor which methods produce the most consistent results over time.
How often should you update a sales forecast?
You should update your sales forecast whenever there is sufficient new evidence about your current pipeline. This may occur weekly during a typical quarter and/or daily as the end of a quarter approaches. Your sales forecast update frequency should mirror the frequency of your sales motion.
Make the forecast explainable
A good forecast is one that explains what you expect for future sales, identifies where there are risks and uncertainties in achieving those sales expectations and identifies actions you can take now to alter the expected outcome of future sales.
A forecast becomes useful when it explains the number, the risk and the action that could change the outcome.
Choose the sales forecasting techniques that fit your business and customer segment as well as possible. Select them carefully and make sure you have evidence from buyers, not just your own assumptions, to support how they may behave. Begin improving the conversations that develop this evidence by starting with your next meeting.